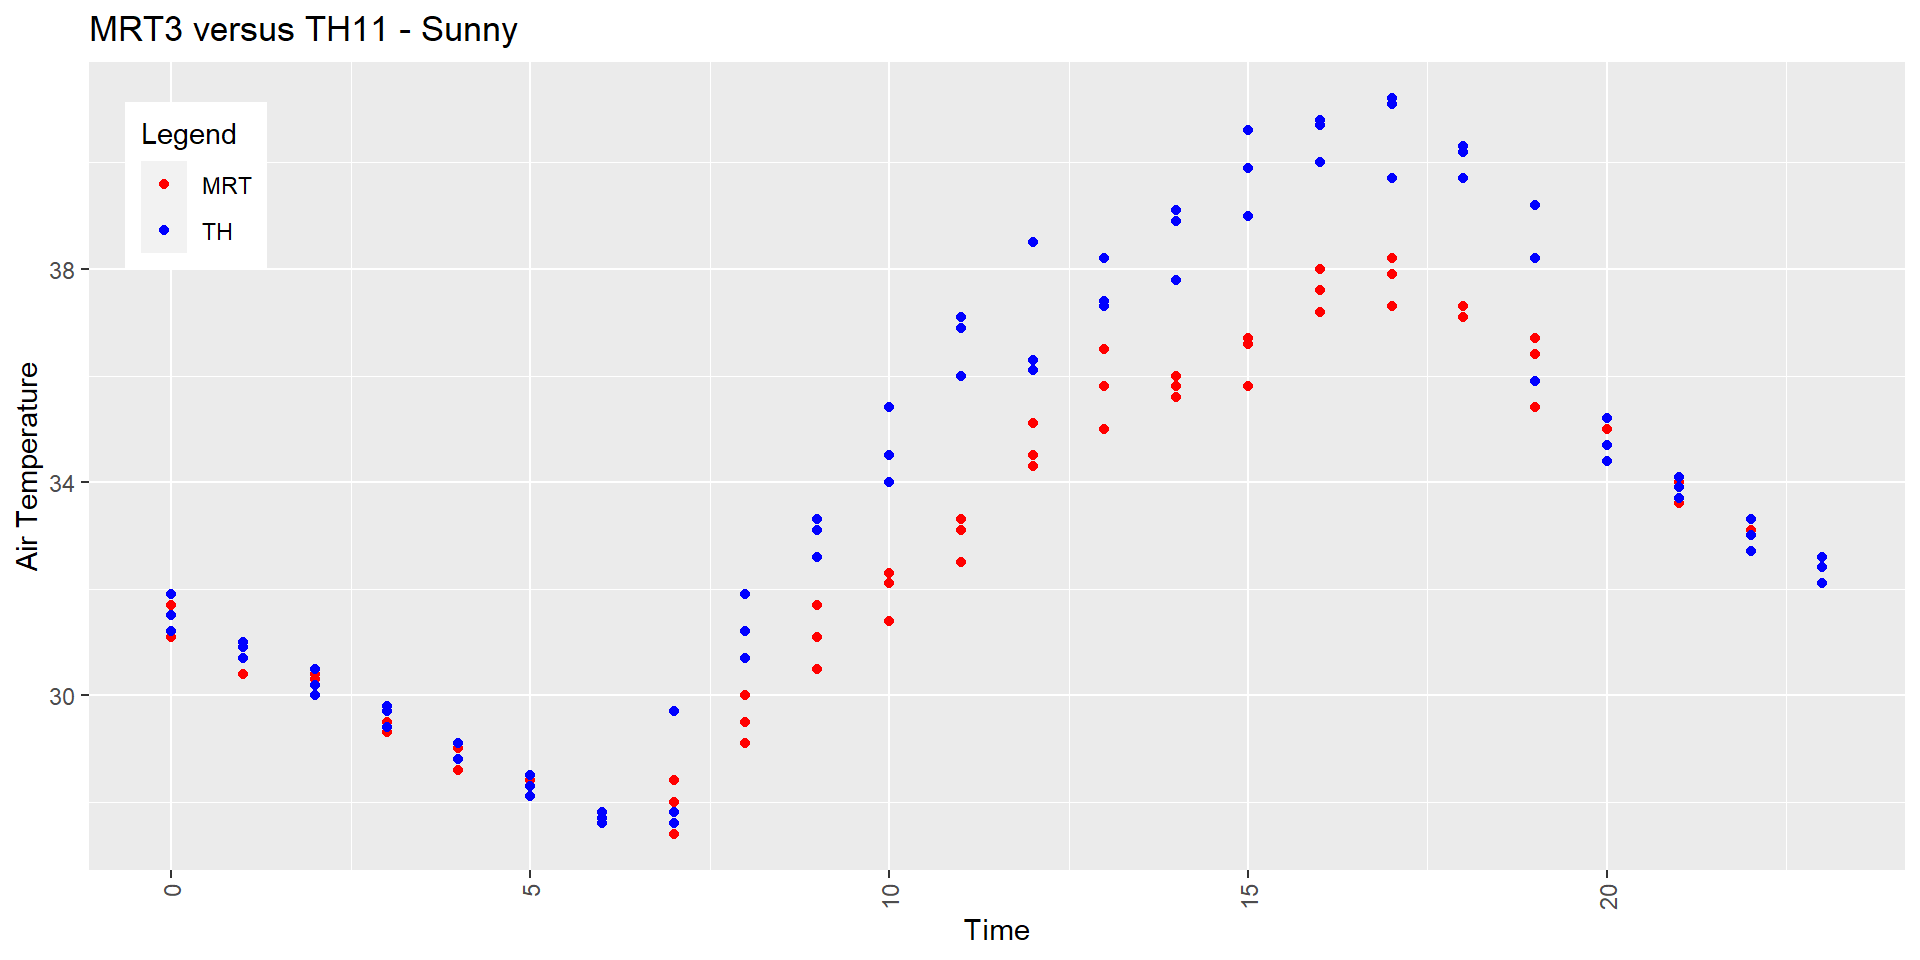
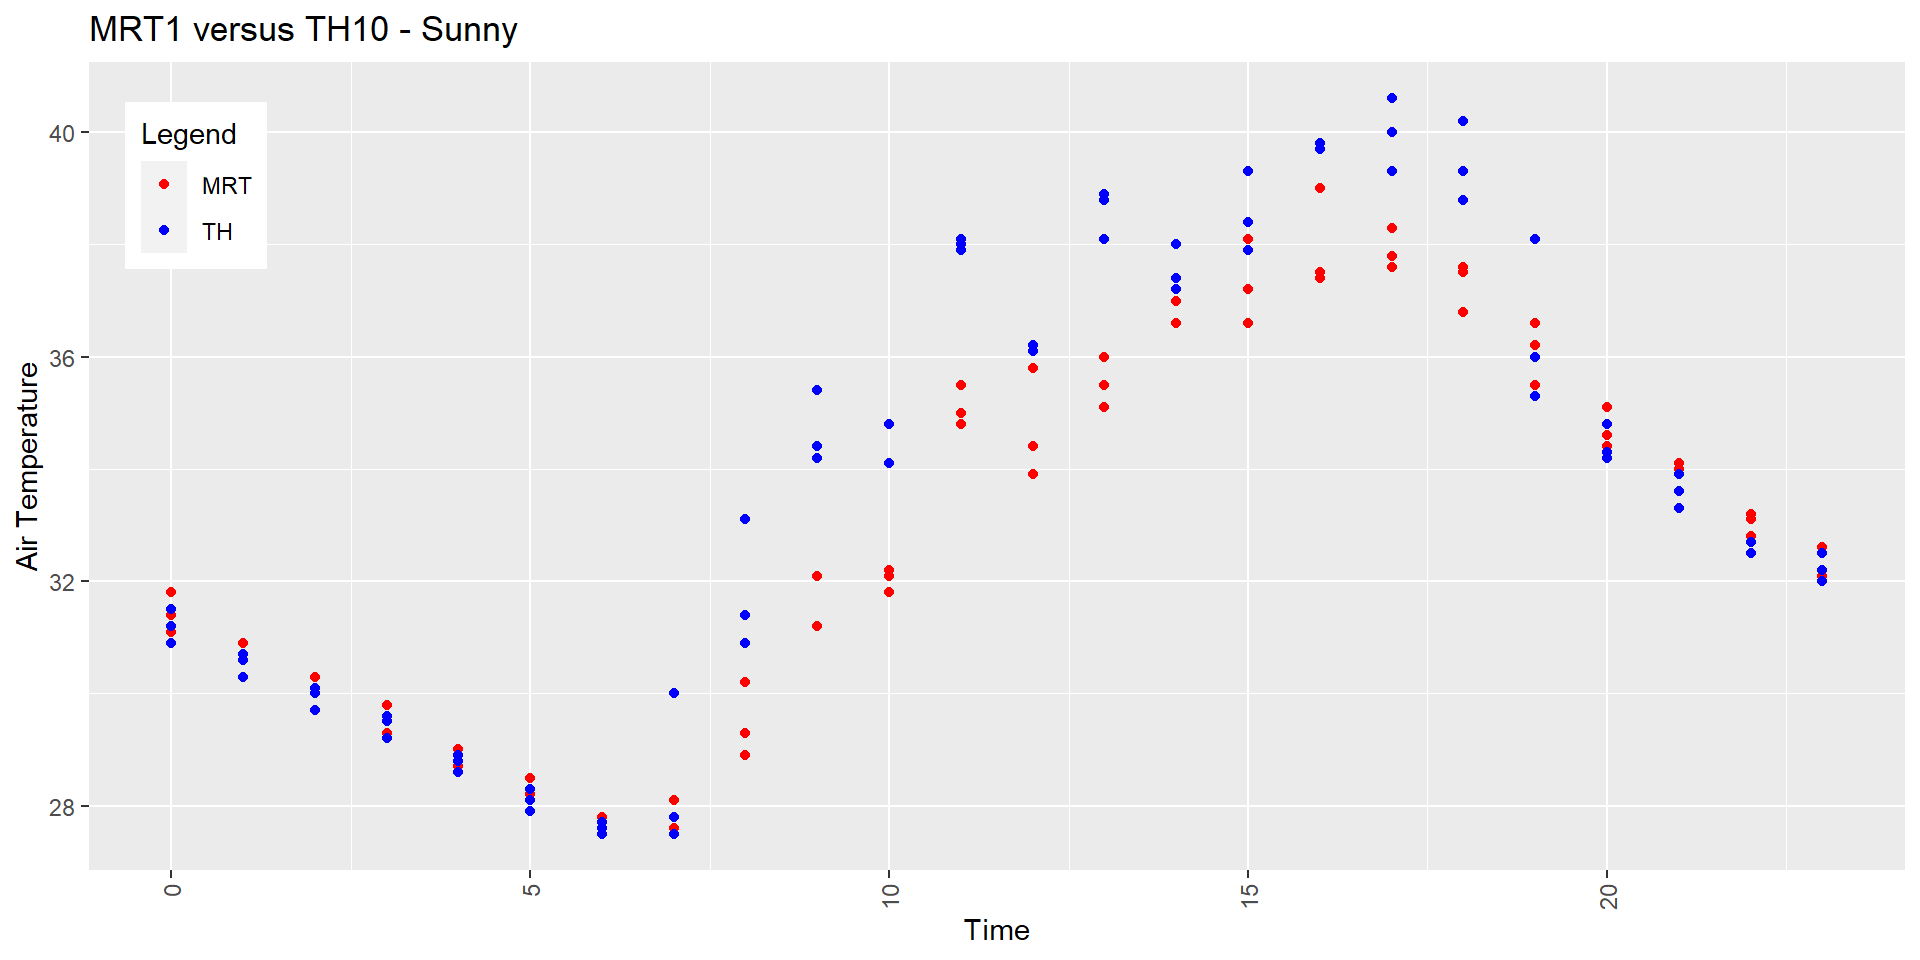
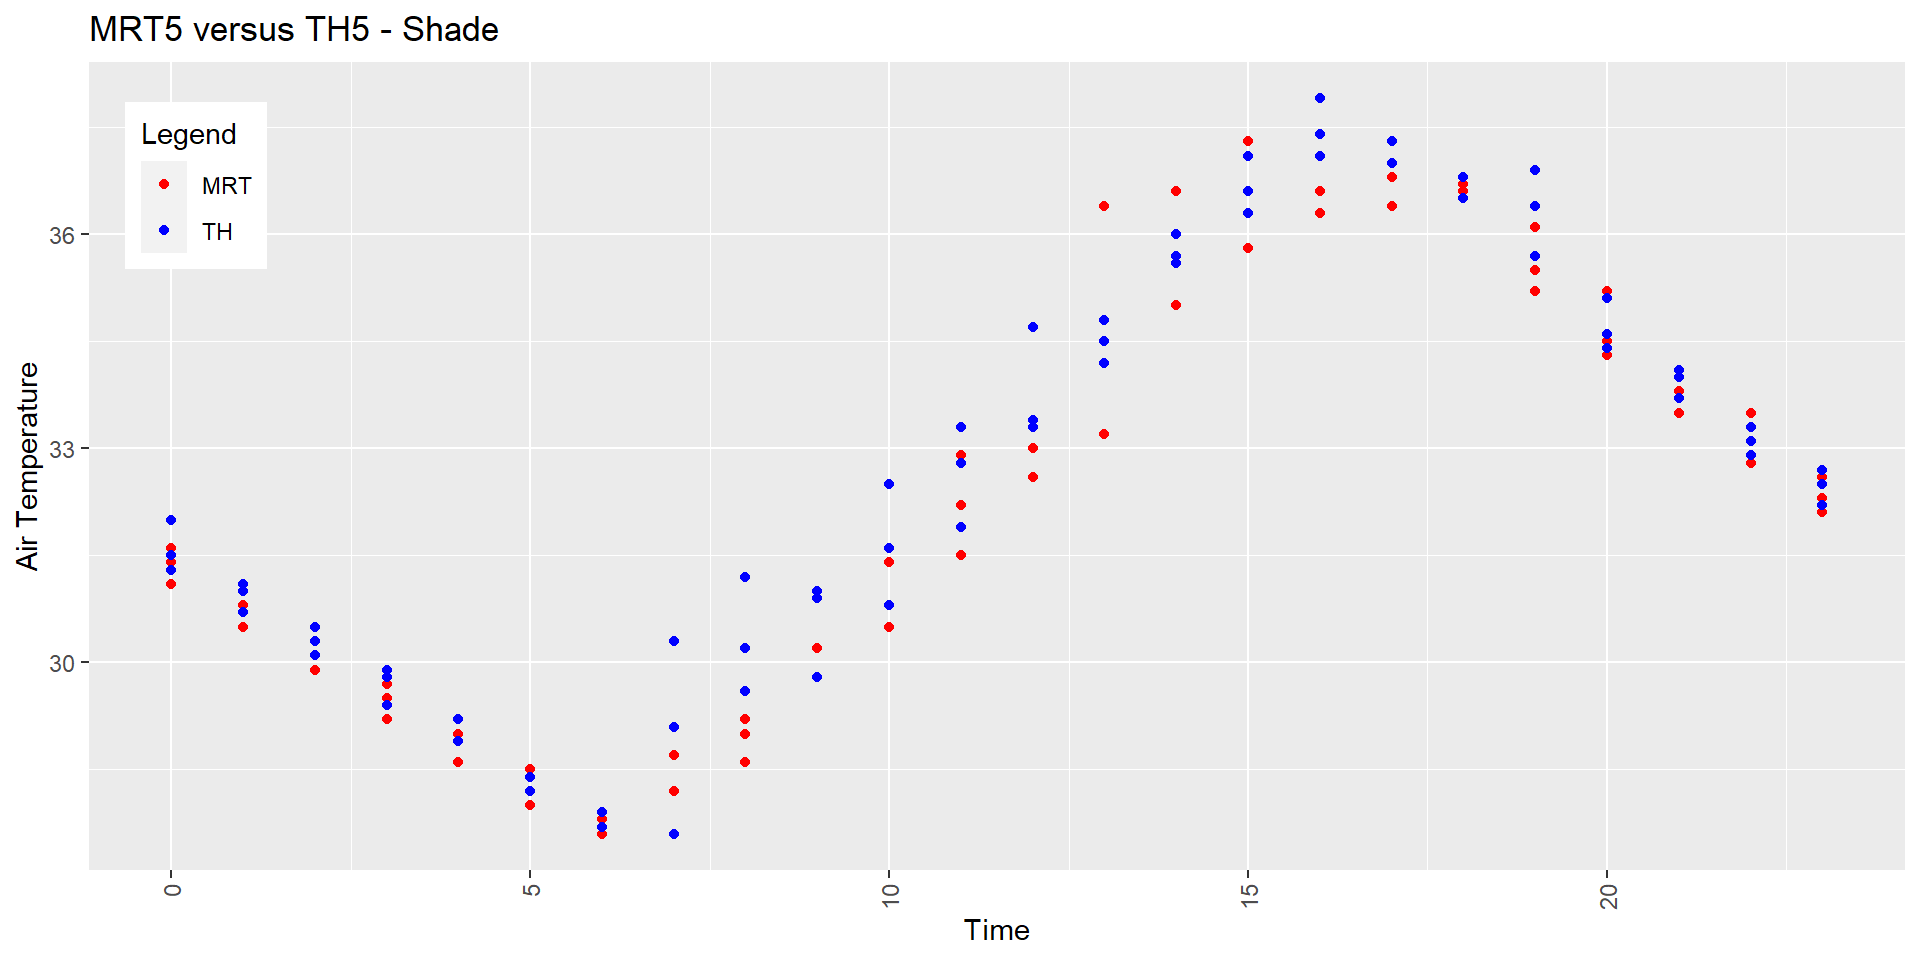
MRT vs TH
Both MRT and TH sensors capture and report air temperature. The difference is that the TH sensor has a white plastic probe while the MRT sensor has a shiny probe. We need to see if there is any difference in capturing data during different hours of the day. The plots below visualize the air temperature captured from MRT and TH sensors for an entire day.
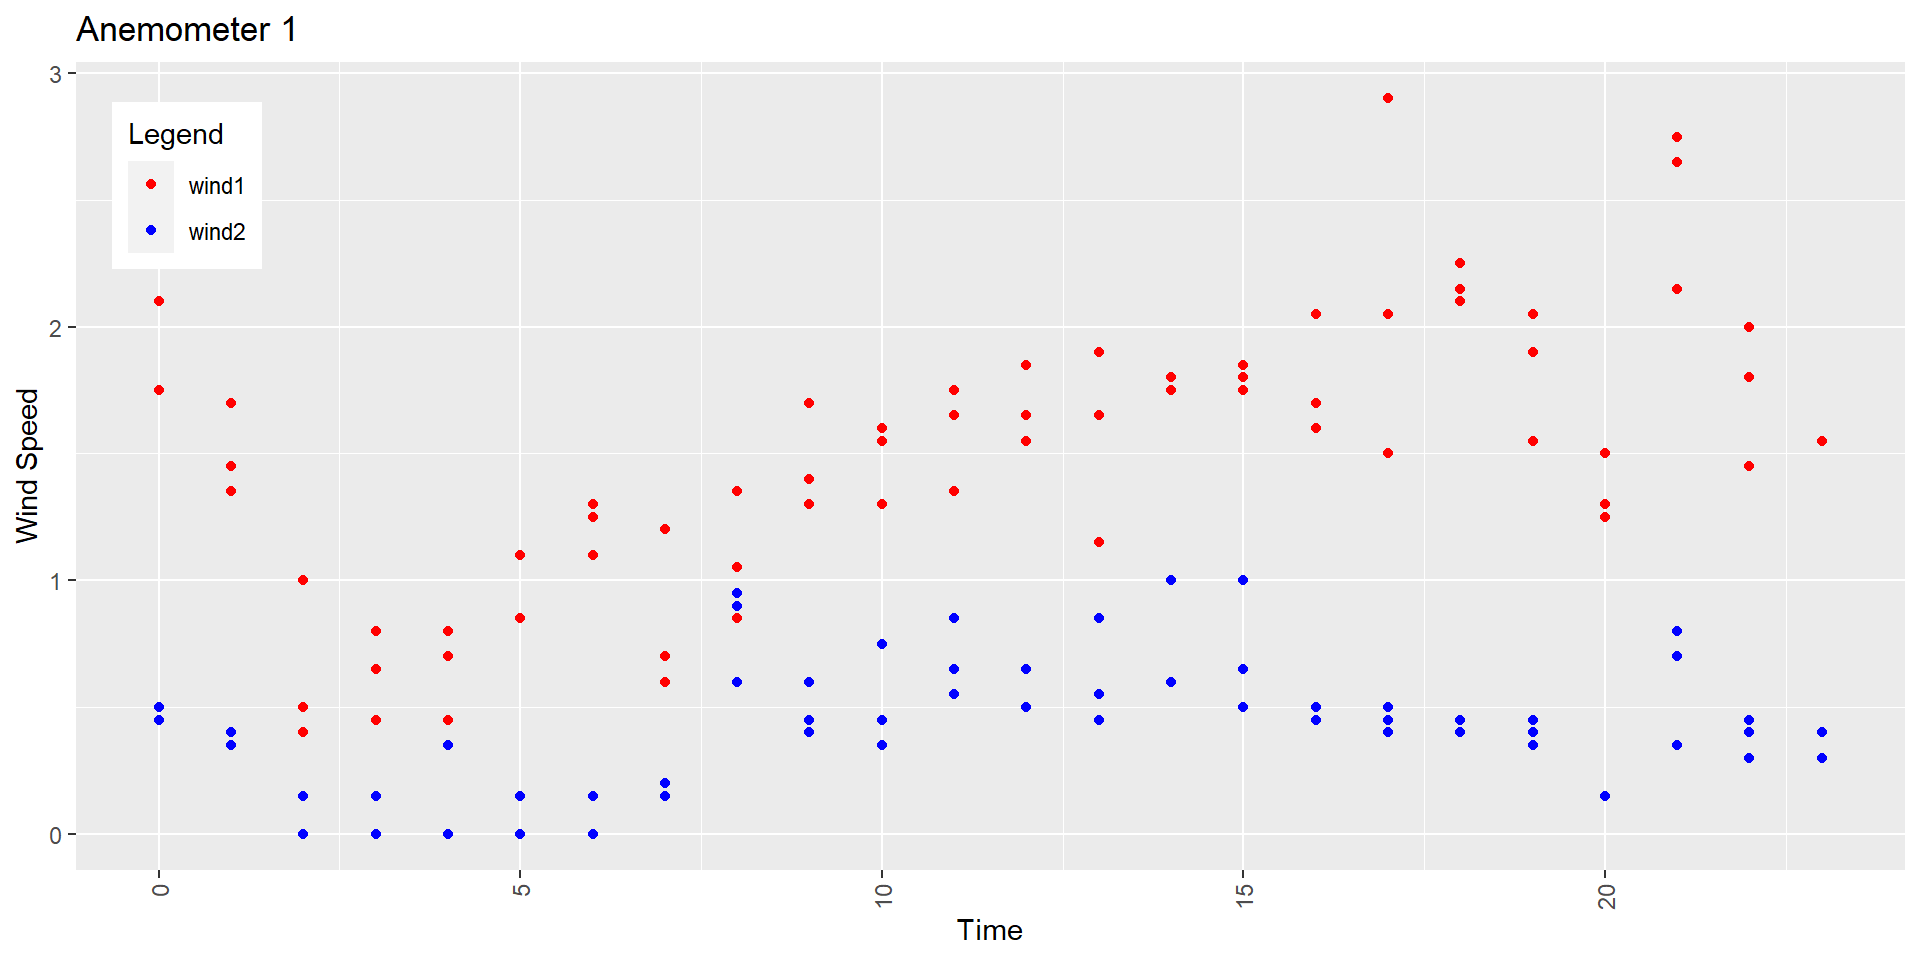
Anemometer 1 vs Anemometer 2
Anemometer 1 is located on a light pole in the middle of the parking lot of Pegasus building while Anemometer 2 is located under a oak tree which means Anemometer 1 is in an open area while Anemometer 2 is under a shaded area. The plots below visualize the wind speed of Anemometer 1 & 2 for an entire day.
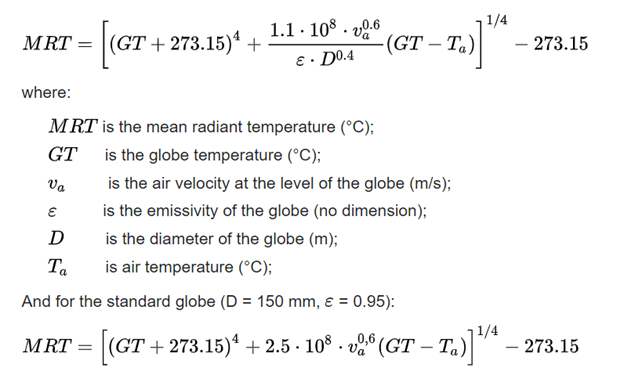
Mean Radiant Temperature (MRT) Calculation
Mean radiant temperature (MRT) is a measure of the average temperature of the surfaces, with which it will exchange thermal radiation. For a given point, the mean radiant temperature can be measured using global temperature, air temperature, wind speed, diameter of a globe, and the emissivity of the globe.
Shade vs Sunny vs Small Tree
Our sensors are installed and located in different locations, such as under a big tree (shade), in an open area (sunny), and under a small tree (small tree). After calculating the mean radiant temperature, we are now interested to see if there is any difference in air temperature, global temperature, or mean radiant temperature in different locations. We made a repeated measure model to compare these scenarios.
Dependent Varible: air_temp

Contrast Results:
 contrast            estimate    SE df t.ratio p.value
 Sunny vs Shade         0.988 0.305  3   3.239  0.0479
 Sunny vs Small Tree    0.362 0.305  3   1.189  0.3200
 Small Tree vs Shade    0.625 0.305  3   2.050  0.1327

Degrees-of-freedom method: containment


Dependent Varible: GT

Contrast Results:
 contrast            estimate   SE df t.ratio p.value
 Sunny vs Shade          7.58 1.38  3   5.480  0.0119
 Sunny vs Small Tree     2.17 1.38  3   1.570  0.2143
 Small Tree vs Shade     5.40 1.38  3   3.910  0.0297

Degrees-of-freedom method: containment


Dependent Varible: MRT

Contrast Results:
 contrast            estimate   SE df t.ratio p.value
 Sunny vs Shade          21.6 4.14  3   5.225  0.0136
 Sunny vs Small Tree      5.6 4.14  3   1.352  0.2691
 Small Tree vs Shade     16.0 4.14  3   3.873  0.0305

Degrees-of-freedom method: containment