DART Temperature Analysis
We have chosen 08/25/2023 temperature data for this analysis because it was the highest temperature recorded this year (Dallas News, 2023). We intend to check if there is any significant statistical difference in temperature captured by our sensors which are placed under different environments.
- Sensor list:
- Sensor TH25 is located inside a DART bus shelter, and the bus shelter is under the sun
- Sensor TH24 is located inside a DART bus shelter, but the bus shelter is near a big tree (some shades from the tree)
- Sensor TH44 is located inside a big tree (shaded)
- Sensor TH38 is located under the sun (sunny)
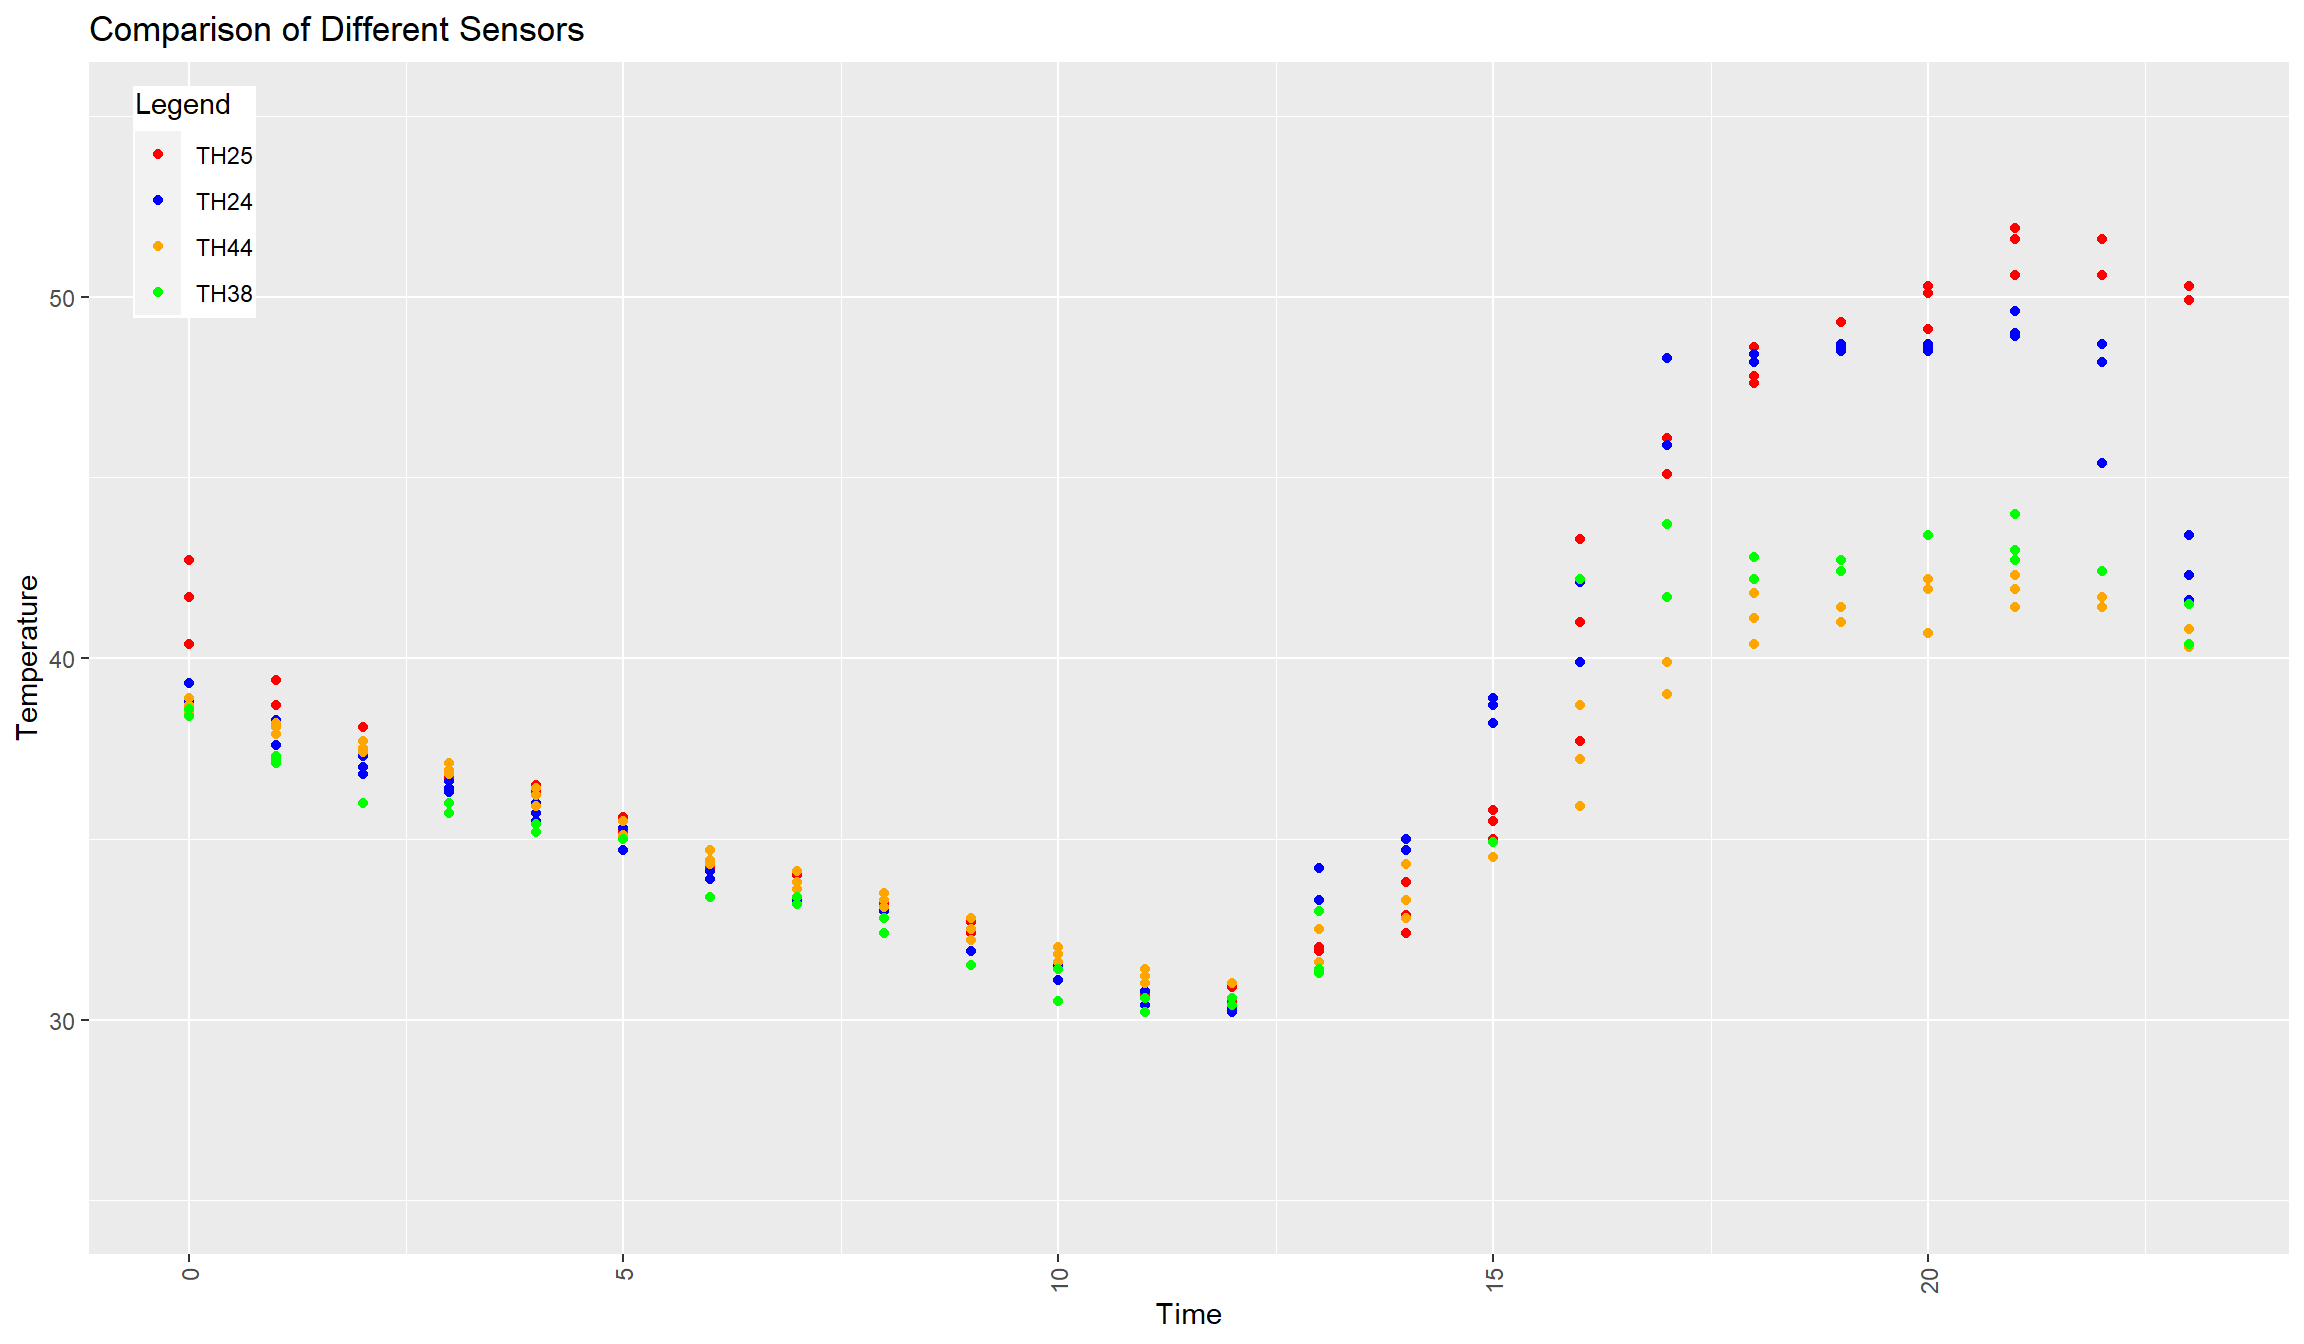
Temperature Distribution
Based on our analysis, the temperature captured by sensor TH44 (shaded) during the hottest time of the day is significantly lower than the temperature captured by sensors TH25 and TH24. This analysis further shows the impacts of trees in reducing the temperature and increasing comfort. Another noteworthy point we learned from this analysis is that the temperature captured by TH38 (sunny) is actually lower than the temperature captured by TH25 and TH24 which shows that the radiant temperature from the DART bus shelter is making the shaded area under the bus shelter even hotter than sunny areas with no shelter which shows the benefit of tree shades over bus shelter shades.
Visualization